Bihar Legislative Assemble Election 2025
Comprehensive Analysis and Predictions
Party-wise Prediction Analysis
Predicted seat distribution for major political parties in Bihar General Election 2025.
| S.No. | Alliance | Party Name | Estimated Seats Prediction | Expected Total Seats | Estimated Plus Minus |
|---|---|---|---|---|---|
| 1 | NDA | BJP | 91 | 186 | ±15 |
| 2 | JDU | 68 | ±10 | ||
| 3 | LJP(RV) | 16 | ±5 | ||
| 4 | RLM | 5 | ±2 | ||
| 5 | HAMS | 6 | ±2 | ||
| 6 | MGB | RJD | 39 | 50 | ±10 |
| 7 | INC | 5 | ±2 | ||
| 8 | VIP | 1 | ±2 | ||
| 9 | CPI(M) | 1 | ±2 | ||
| 10 | CPI(ML) | 4 | ±2 | ||
| 11 | CPI | 0 | ±2 | ||
| 12 | - | AIMIM | 5 | 5 | ±2 |
| 13 | - | Others | 2 | 2 | ±2 |
| Total | 243 |
Predicted Seat Distribution
BJP (125 - 51.4%)
JDU (48 - 19.8%)
RJD (52 - 21.4%)
INC (18 - 7.4%)
LJP(RV) (5 - 2.1%)
HAMS (4 - 1.6%)
RLM (3 - 1.2%)
CPI(ML) (3 - 1.2%)
VIP (2 - 0.8%)
CPI(M) (2 - 0.8%)
CPI (1 - 0.4%)
AIMIM (5 - 2.1%)
Others (0 - 0%)
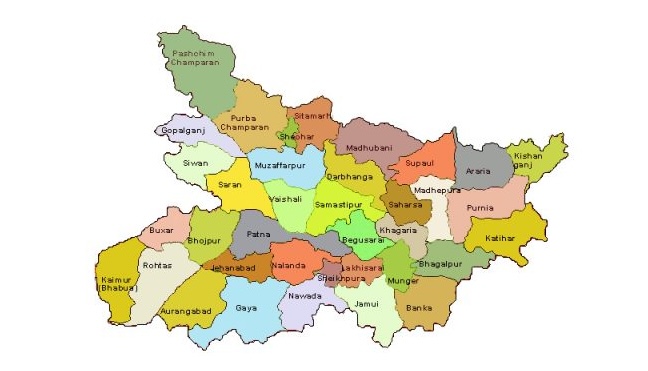
Bihar Electoral Map

Methodology / कार्यप्रणाली
- The survey is based on field visit to constituencies and direct interaction with people.
- The methodology adopted was both structured and unstructured questionnaire, participative and non-participative observation, random samples and selective samples and group discussions.
- The largest group consisted of different age groups, different income groups, different social backgrounds (OC/BC/SC/ST and minorities), different occupations (Govt. and non-Govt.), male and female, students, agriculture & labour, businessmen, professionals, house wives, farmers and auto drivers etc.
- This is a trend setting survey because predicting candidate wise winning margin is a difficult process and a bit technical. We could successfully do it in 2017 UP assembly Elections and 2024 A.P assembly elections and we were correct to a large extent in many constituencies. This needs lot of planning and collecting error free data which sometimes may go wrong also. I hope you understand the difficulties and will appreciate our effort and overlook shortcomings. Your suggestions are highly appreciated.
- यह सर्वेक्षण क्षेत्रों (निर्वाचन क्षेत्रों) के फील्ड विजिट और लोगों से सीधे संवाद पर आधारित है।
- अपनाई गई कार्यप्रणाली में संरचित एवं असंरचित प्रश्नावली, सहभागी एवं गैर-सहभागी अवलोकन, रैंडम सैंपल (यादृच्छिक नमूने) और चयनित नमूने तथा समूह चर्चा शामिल थे।
- सर्वेक्षण में विभिन्न आयु वर्गों, आय वर्गों, सामाजिक पृष्ठभूमियों (OC/BC/SC/ST एवं अल्पसंख्यक), विभिन्न व्यवसायों (सरकारी एवं गैर-सरकारी), पुरुष एवं महिला, छात्र, कृषि एवं श्रमिक, व्यवसायी, पेशेवर, गृहिणी, किसान और ऑटो चालकों आदि को शामिल किया गया।
- यह एक ट्रेंड सेटिंग सर्वेक्षण है क्योंकि प्रत्याशीवार जीत के अंतर की भविष्यवाणी करना एक कठिन और तकनीकी प्रक्रिया है। हमने इसे 2017 उत्तर प्रदेश विधानसभा चुनावों और 2024 आंध्र प्रदेश विधानसभा चुनावों में सफलतापूर्वक किया था और कई निर्वाचन क्षेत्रों में हमारे परिणाम काफी हद तक सही थे। यह प्रक्रिया काफी योजना और त्रुटिरहित डेटा संग्रह की मांग करती है, जो कभी-कभी गलत भी हो सकता है। हमें उम्मीद है कि आप इन कठिनाइयों को समझेंगे और हमारे प्रयासों की सराहना करेंगे तथा छोटी-मोटी कमियों को नज़रअंदाज़ करेंगे। आपके सुझावों का स्वागत है।
Constituency-wise Survey Report
Comprehensive constituency-wise survey data for Bihar General Election 2025.
| S.No. | District | Constituency | Winning Party/Alliance | Expected Votes | Runner Up Party/Alliance | Expected Votes | Winning Margin | Error Margin ±5000 votes |
|---|---|---|---|---|---|---|---|---|
| Loading constituency data... | ||||||||